- Success: Reserp 99.8% (998/1,000); Bright Data 79.0% (790/1,000).
- Result URLs: Reserp 11 p50 / 17 p95; Bright Data 9 / 14.
- Latency: Reserp 2.66s p50 / 4.11s p95; Bright Data 3.32s / 11.58s.
External URLs across all recorded responses
Higher is better. Across all 1,000 recorded responses per provider, Reserp is higher at both URL-count percentiles: p50: Reserp 11 vs Bright Data 9; p95: Reserp 17 vs Bright Data 14. Unsuccessful or empty responses remain in the distribution as zero URLs: Reserp had 2 zero-URL responses; Bright Data had 210.
Even when filtering to successful responses only, Reserp remains higher at both URL-count percentiles: p50: Reserp 11 vs Bright Data 9; p95: Reserp 17 vs Bright Data 14.
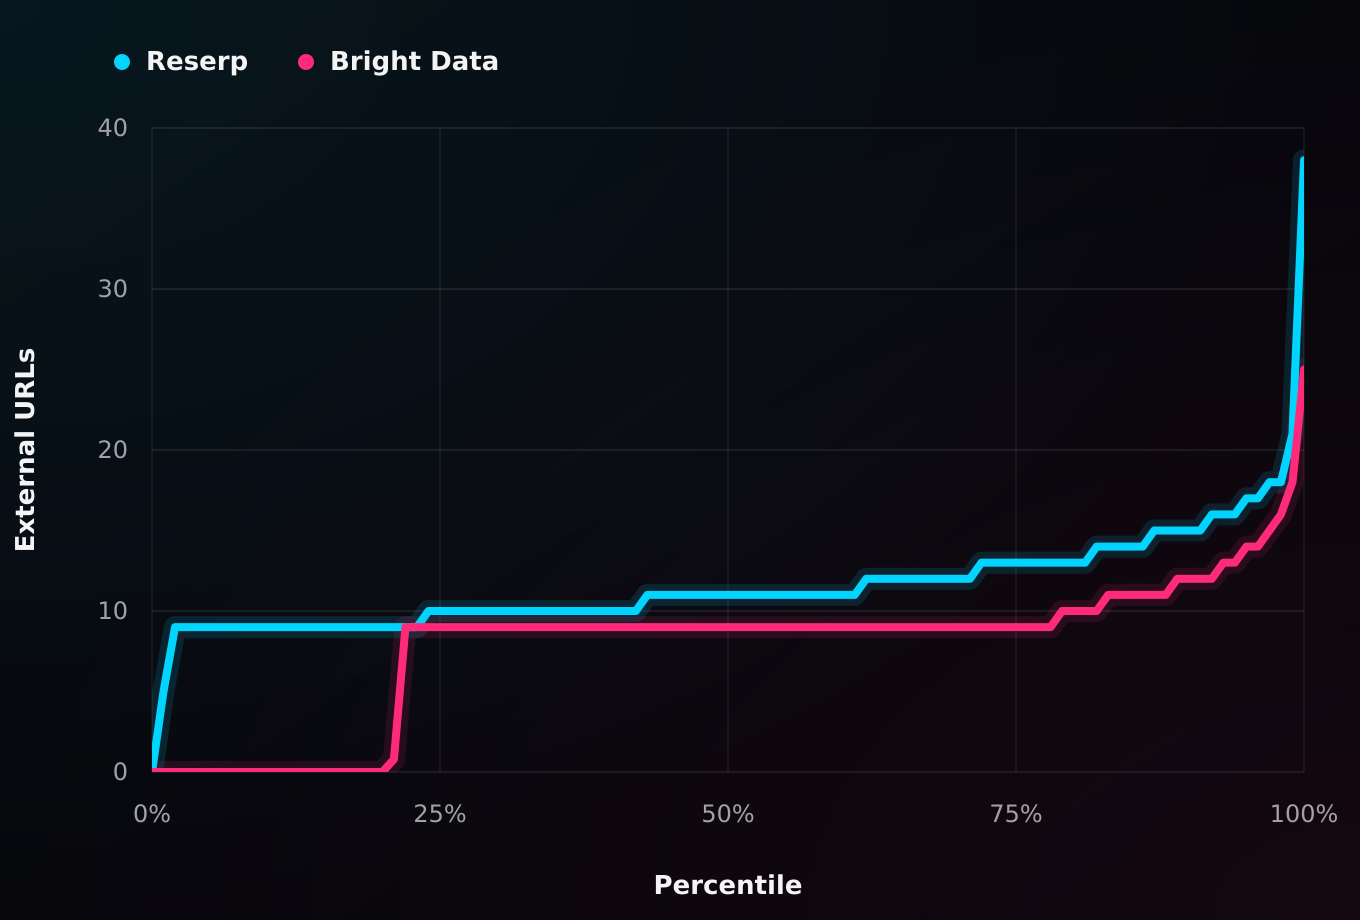
Unique external URLs across all responses — unsuccessful or empty responses count as zero URLs.
Latency across all recorded responses
Lower is faster. Each line plots p0 through p100 across every recorded first response, including unsuccessful output; the latency axis is logarithmic. Reserp completed at 2.66s p50 / 4.11s p95; Bright Data at 3.32s / 11.58s.
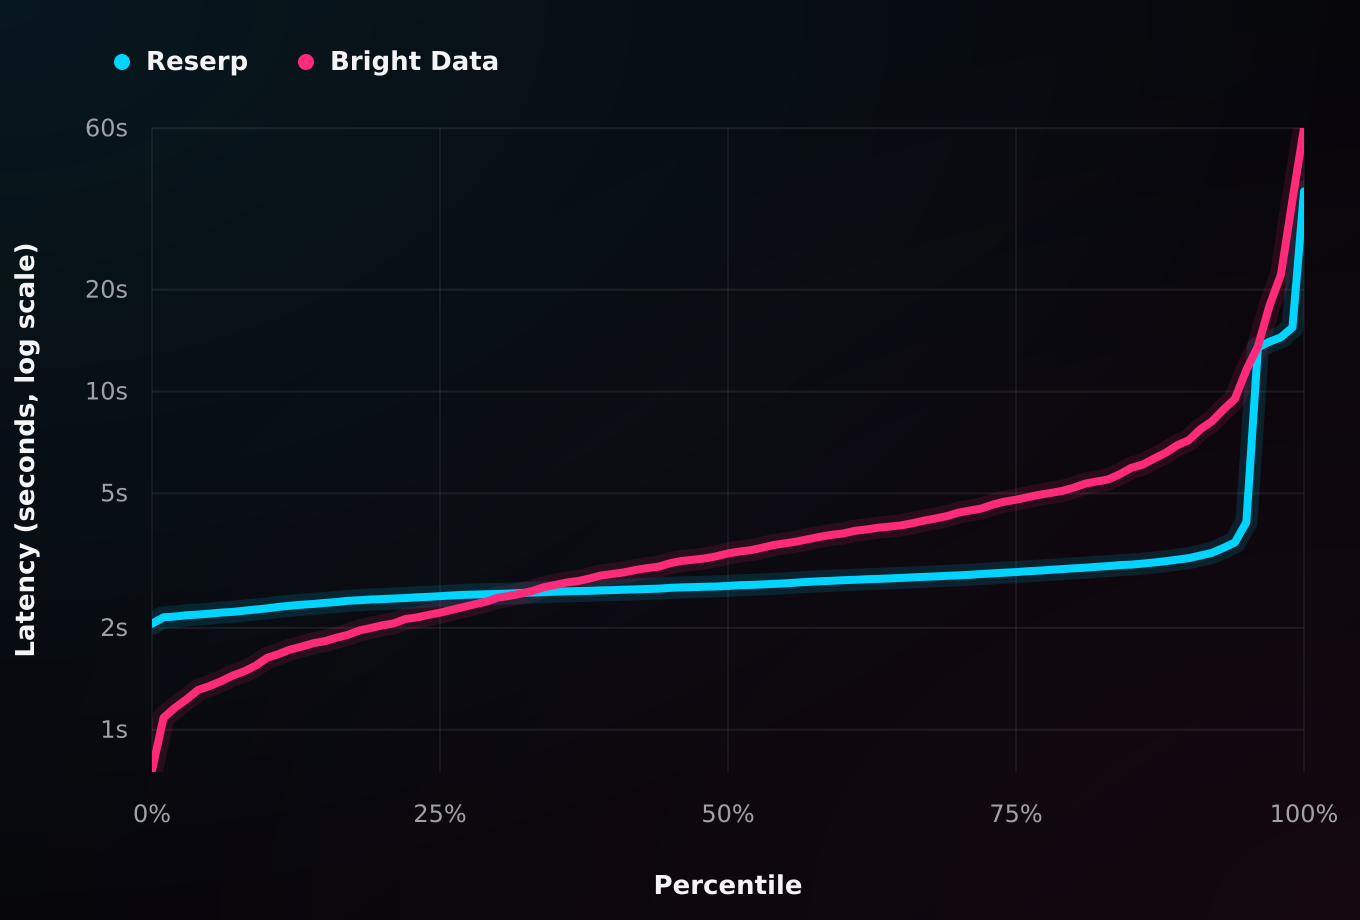
First-response latency across all responses — logarithmic latency scale; lower is faster.
These all-response distributions retain every request, including unsuccessful, empty, or rejected output, so availability remains visible instead of disappearing from the comparison. Successful-response latency also favored Reserp: 2.66s at p50 and 4.05s at p95, versus Bright Data’s 3.36s at p50 and 13.14s at p95.
Need dependable Google results without building retry-heavy scraping infrastructure? Explore the Reserp API documentation or review current pricing.
Reserp vs Bright Data at a glance
| Metric | Reserp | Bright Data |
|---|---|---|
| Successful responses | 998/1,000 | 790/1,000 |
| Success rate | 99.8% | 79.0% |
| Successful latency, p50 / p95 | 2.66s / 4.05s | 3.36s / 13.14s |
| All-response latency, p50 / p95 | 2.66s / 4.11s | 3.32s / 11.58s |
| Unique external URLs on success, p50 / p95 | 11 / 17 | 9 / 14 |
| Responses with zero qualifying URLs | 2 | 210 |
| Successful-response body size, p50 / p95 | 3.93 / 5.49 KiB | 21.62 / 418.75 KiB |
A “successful response” had to complete over HTTP, contain valid JSON in the expected provider shape, include at least one external result URL, and contain no explicit CAPTCHA or challenge signal. An HTTP 200 without usable result data did not count as success.
Reserp reliability: 208 more usable responses
Reserp succeeded on 99.8% of the 1,000-query corpus, compared with 79.0% for Bright Data. The Wilson 95% intervals were 99.3–99.9% for Reserp and 76.4–81.4% for Bright Data. A query-ID bootstrap placed Reserp's observed advantage between 18.4 and 23.4 percentage points.
| Outcome for the same query ID | Queries |
|---|---|
| Both providers successful | 789 |
| Reserp successful, Bright Data unsuccessful | 209 |
| Bright Data successful, Reserp unsuccessful | 1 |
| Neither provider successful | 1 |
For production teams, the practical difference is straightforward: unsuccessful first responses become retries, missing records, fallback logic, or manual review. In this comparison, Reserp produced usable output for 208 more searches without retrying either provider.
Reserp delivered faster useful Google Search results
Among successful responses, Reserp's median latency was 2.66 seconds, compared with 3.36 seconds for Bright Data. At p95, Reserp completed in 4.05 seconds versus 13.14 seconds for Bright Data.
| Successful-response latency | Reserp | Bright Data |
|---|---|---|
| p50 | 2.66s | 3.36s |
| p75 | 2.92s | 4.94s |
| p90 | 3.22s | 7.64s |
| p95 | 4.05s | 13.14s |
| p99 | 15.47s | 36.11s |
The tail matters for agents and batch workloads because one slow search can block an entire step. Reserp's p95 successful response arrived about 9.1 seconds sooner in this dataset. The all-response chart is also provided, but successful-response latency is the more useful operational measure: a quick rejection is not a quick result.
Reserp returned more external URLs per successful response
Successful Reserp responses contained a median of 11 unique external URLs, compared with 9 for Bright Data. At p95, the comparison was 17 versus 14.
| Successful-response unique external URLs | Reserp | Bright Data |
|---|---|---|
| p25 | 10 | 9 |
| p50 | 11 | 9 |
| p95 | 17 | 14 |
| p99 | 21 | 18.1 |
The providers expose different response models. Reserp counts unique external URLs in visible result blocks; Bright Data counts them across typed content fields. Google navigation, pagination, assets, invalid URLs, and common tracking variants were excluded. URL count measures returned evidence—not ranking relevance—but it directly affects how much material an agent, crawler, or retrieval system can use downstream.
Reserp delivered more URLs in smaller responses
Reserp's successful response body was 3.93 KiB at the median and 5.49 KiB at p95. Bright Data's was 21.62 KiB at the median and 418.75 KiB at p95.
| Successful-response payload | Reserp | Bright Data |
|---|---|---|
| Body size, p50 | 3.93 KiB | 21.62 KiB |
| Body size, p95 | 5.49 KiB | 418.75 KiB |
| Unique external URLs per 100 KiB, p50 | 281.32 | 43.04 |
Bright Data's larger typed modules may reduce some downstream classification work. Reserp's compact generic blocks are lighter to transfer, store, inspect, and pass through application pipelines. The better fit depends on whether a team prioritizes a compact universal response or provider-specific structured modules.
Reserp surfaced listed reference sources more often
Half of the corpus consisted of 500 neutral SimpleQA questions with published reference lists. Those lists are incomplete, so the figures below measure source presence rather than factual accuracy or semantic relevance.
| Evidence found across all 500 neutral queries | Reserp | Bright Data |
|---|---|---|
| At least one listed reference domain | 95.2% | 74.2% |
| At least one exact listed reference URL | 85.4% | 64.4% |
Reserp returned listed domains and exact source URLs more often across the full neutral-query set.
Data behind the comparison
The article uses a frozen corpus of 1,000 query IDs: 500 neutral factual questions and 500 technical or commercial searches. Each provider received one recorded request per query. There were no retries, recovery calls, or trimmed outliers.
| Data field | Value |
|---|---|
| Searches | 1,000 US-English Google queries per provider |
| Corpus composition | 500 SimpleQA; 500 technical/commercial |
| Locale | Google gl=us, hl=en |
| Recorded requests | 2,000 total; one per provider-query |
| Request controls | Maximum 8 active requests; 200ms start interval; 60s timeout |
| Provider measurement | Separate single-pass collection windows using the same frozen corpus and success definition |
| Retries and outlier trimming | None |
| Measurement date | August 25, 2026 |
| Cohort success | Reserp | Bright Data |
|---|---|---|
| Neutral factual queries | 498/500 (99.6%) | 393/500 (78.6%) |
| Technical/commercial queries | 500/500 (100.0%) | 397/500 (79.4%) |
Download or cite the complete underlying dataset:
This single self-contained file includes the headline metrics, all 2,000 request-level records, 1,000 matched query outcomes, complete latency and URL-count distributions, the frozen query corpus, protocol, provenance, and source-license text.
Reserp produced and sponsored this dated Google SERP API comparison. It does not cover every Bright Data capability or guarantee future service levels.