
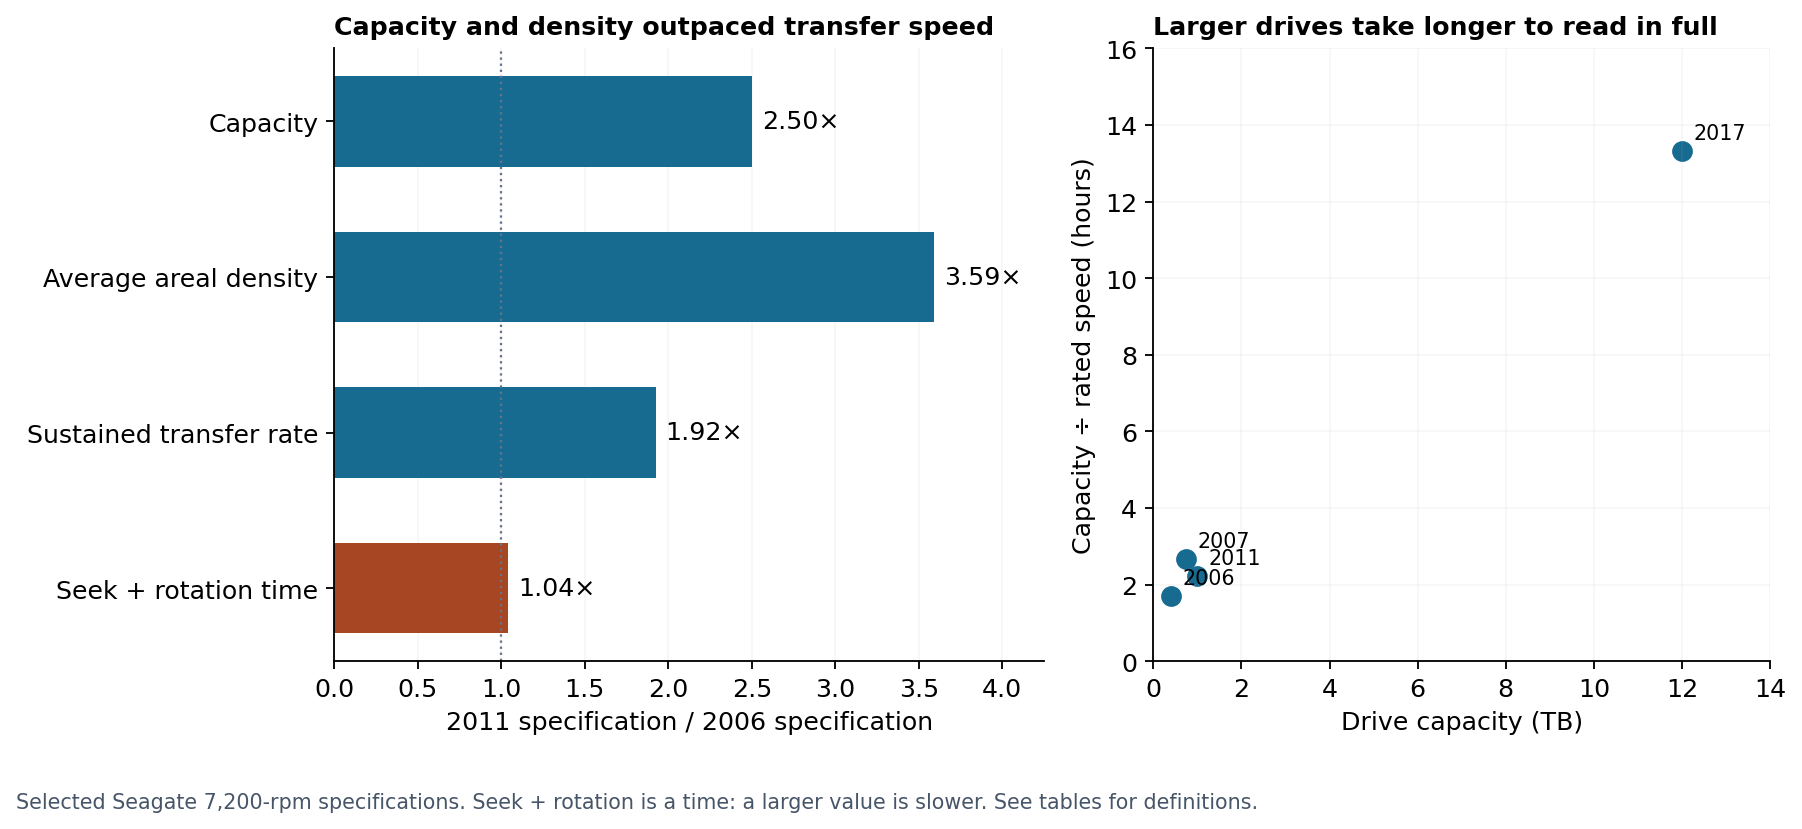
Hard-drive capacity and recording density have grown faster than transfer speed, while mechanical access time has changed much less. A comparison of Seagate’s 2006 and 2011 desktop-drive specifications shows all three parts of that pattern together.
Capacity rises 2.5-fold, average areal density 3.6-fold, and rated sustained transfer speed 1.9-fold. Typical read-seek specifications remain around eight milliseconds; rotational latency stays at 4.16 ms.
| Specification | 400 GB ST3400832AS, 2006 | 1 TB ST31000524AS, 2011 |
|---|---|---|
| Average areal density | 91.56 Gbit/in² | 329 Gbit/in² |
| Sustained transfer speed | 65 MB/s | 125 MB/s |
| Typical average read seek | 8.0 ms | 8.5 ms |
| Average rotational latency | 4.16 ms | 4.16 ms |
| Seek + rotation reference | 12.16 ms | 12.66 ms |
The figures come from Seagate’s 7200.8 manual and 2011 Barracuda manual. We use the detailed typical-seek table; the latter’s summary also gives a less-than-8.5-ms specification. These are manufacturer ratings, not measured latency from our own hardware.
The longer comparison reaches a 12 TB Barracuda Pro in 2017. Against the 400 GB model, capacity increases 30-fold, average density 10.1-fold and sustained speed 3.8-fold. Its manual omits seek time, so it extends the capacity and throughput comparison only.
That imbalance makes full-drive reads longer. Capacity divided by rated speed rises from 1 hour 43 minutes to 13 hours 20 minutes between those endpoints. Real reads can take longer as speed varies across the platter.
The complete dataset contains 64 configurations from nine IBM, Seagate and Western Digital documents, all in the 7,200-rpm desktop class. The paired comparison selects models with the required variables; maximum and average density are kept separate. Interface bandwidth is not substituted for disk transfer speed, and document dates are not treated as launch dates.
Complete comparison · Growth ratios · All 64 configurations · Longer density series · Methods
Research data and calculation scripts, version 3.0 (ZIP, 5 MB). Updated 16 September 2026.